2 Abstract submission and registration
During abstract submission and congress registration, people were asked to provide us with information on their social identity. Here, we provide a summary of the social identities who submitted an abstract and/or attended the congress (abstract submissions are not reported in the manuscript though).
2.1 Abstract submission
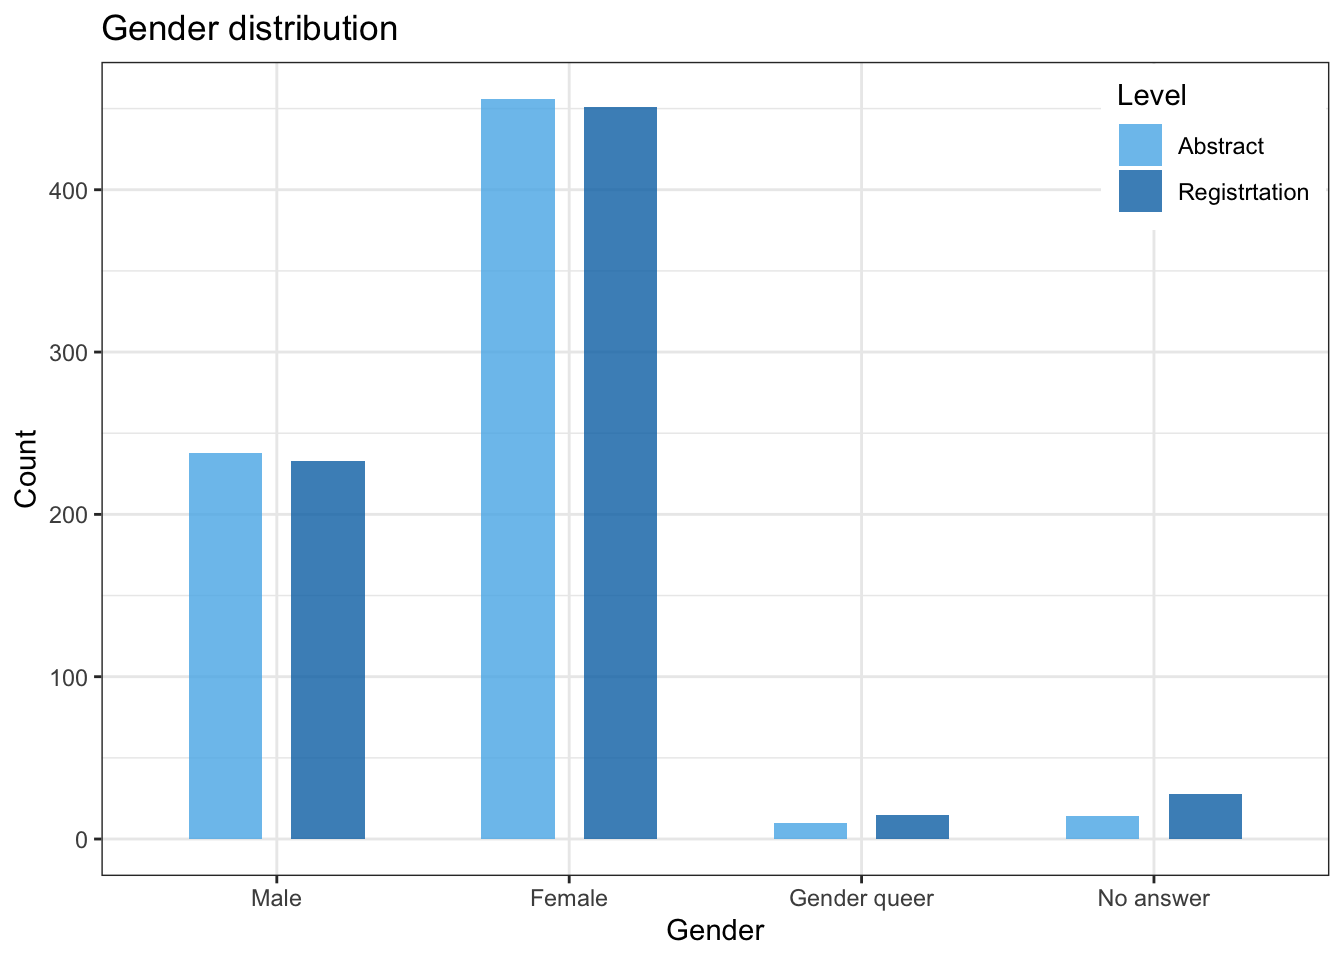
There were a total of 729 abstract submissions, of which the majority used she/her pronouns (hereafter referred to as “women”) (456 / 729). (456 / 729) used he/him pronouns (hereafter referred to as “men”), whereas 10 used she/them, he/them, or they/them pronouns (hereafter referred to as “gender queer”).
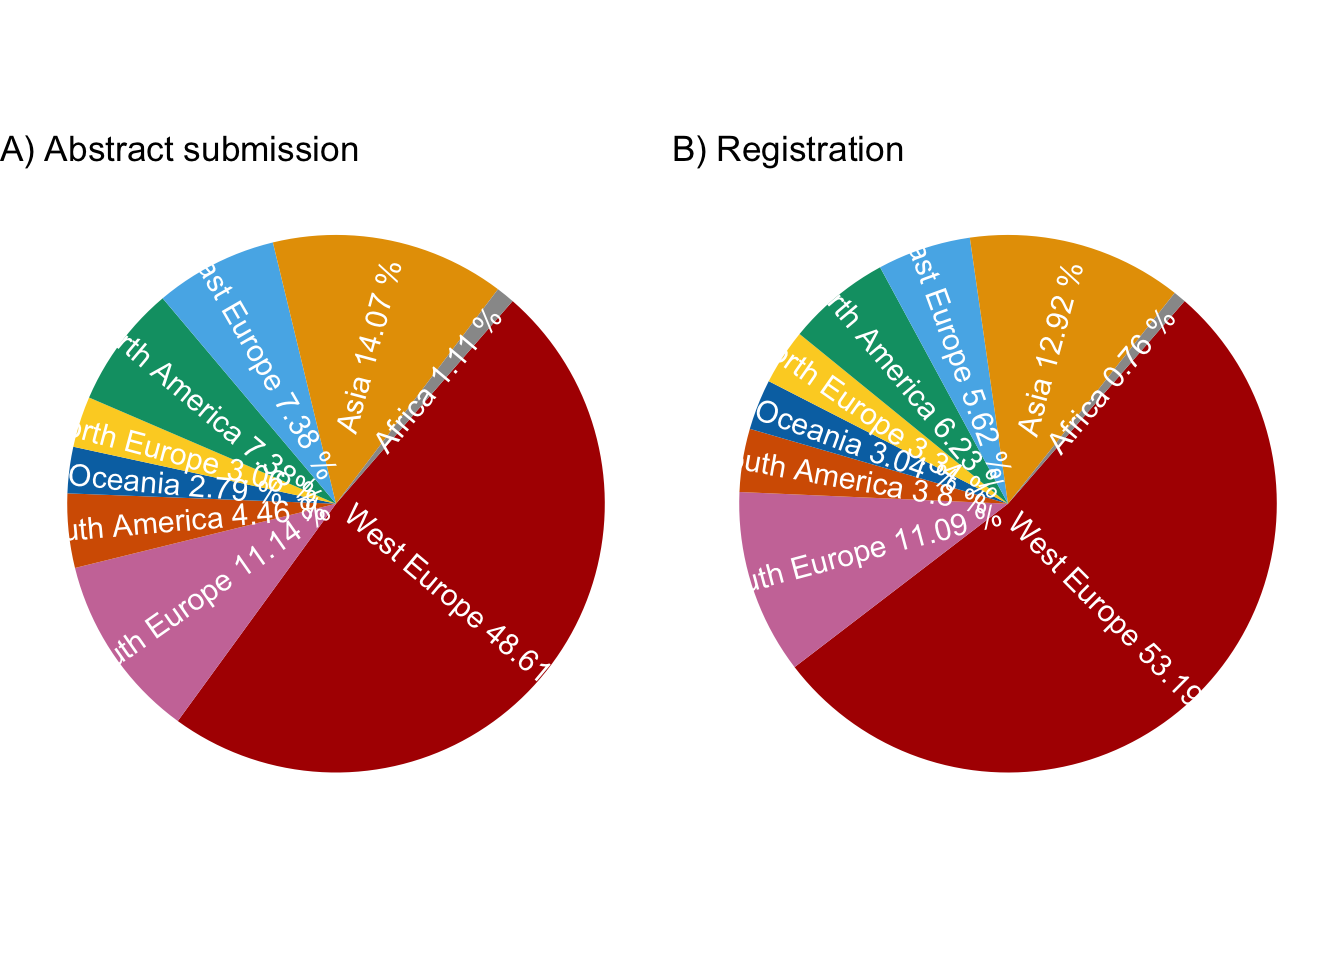
A total of 59 nationalities were represented among those who submitted an abstract. The majority of the abstract submitters originated from Europe (504/729), followed by Asia (101/729), North America (64/729), South America (21/729), Oceania (20/729) and lastly Africa (8/729). Out of all who submitted an abstract, 0 were affiliated with another country than their nationality (Expat status).
2.2 Registration
There were a total of 727 registrations, the majority of which were submitted by women (451 / 727). 233 registrants were men, 15 registrants identified as gender queer.
A total of 59 nationalities were represented among those who registered. The majority of registrations originated from Europe (481/727), followed by Asia (85/727), North America (48/727), Oceania (20/727), South America (18/727), and Africa (5/727).
2.3 Figures
3 Map for Main Figure
3.1 Nationality data
3.1.1 Continent and country representation
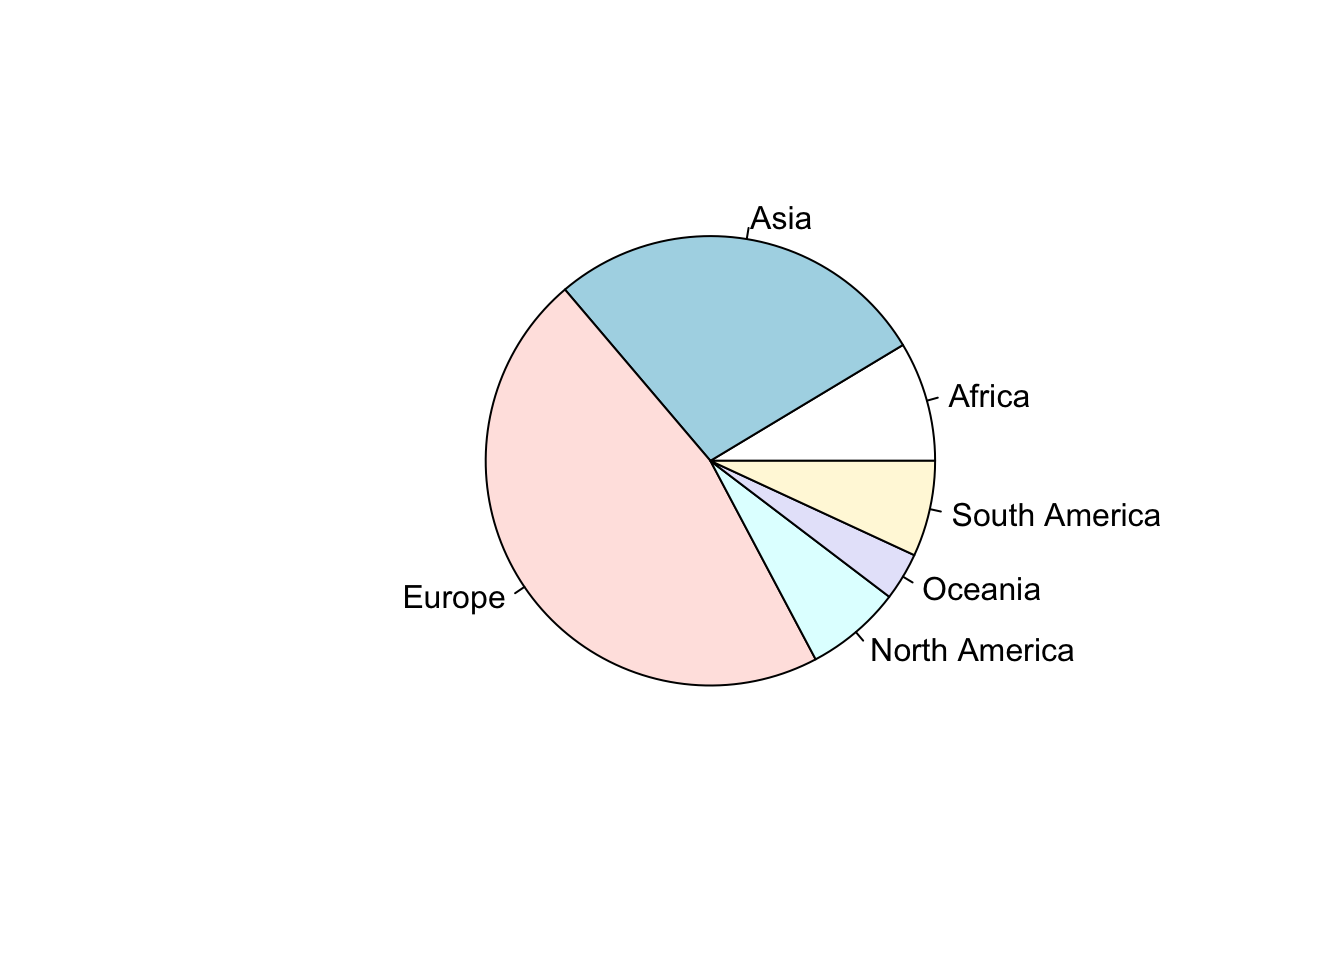
A total of 59 nationalities were represented.
| Continent | Countries | Participation |
|---|---|---|
| Africa | 5 | 5 |
| Asia | 16 | 85 |
| Europe | 27 | 482 |
| North America | 4 | 48 |
| Oceania | 2 | 20 |
| South America | 4 | 18 |
Representation pie chart
       Algeria      Argentina      Australia        Austria     Azerbaijan
             1              1             17             24              1
    Bangladesh        Belarus        Belgium         Brazil         Canada
             2              1              9              8             13
         China       Colombia     Costa Rica        Croatia         Cyprus
             8              6              2              7              1
Czech Republic        Denmark        Ecuador        Finland         France
             9              8              3             10             43
        Gambia        Germany         Greece      Hong Kong        Hungary
             1            166              5              2             10
         India           Iran        Ireland         Israel          Italy
            41              2              4              3             33
         Japan        Lebanon     Luxembourg      Mauritius         Mexico
            10              1              1              1              5
    Montenegro    Netherlands    New Zealand        Nigeria         Norway
             1             17              3              1              1
      Pakistan         Poland       Portugal         Russia         Serbia
             1              4             14              1              1
     Singapore       Slovenia          Spain      Sri Lanka         Sweden
             1              2             21              2              3
   Switzerland         Taiwan       Thailand         Turkey         Uganda
            20              4              2              4              1
            UK        Ukraine            USA
            66              1             28