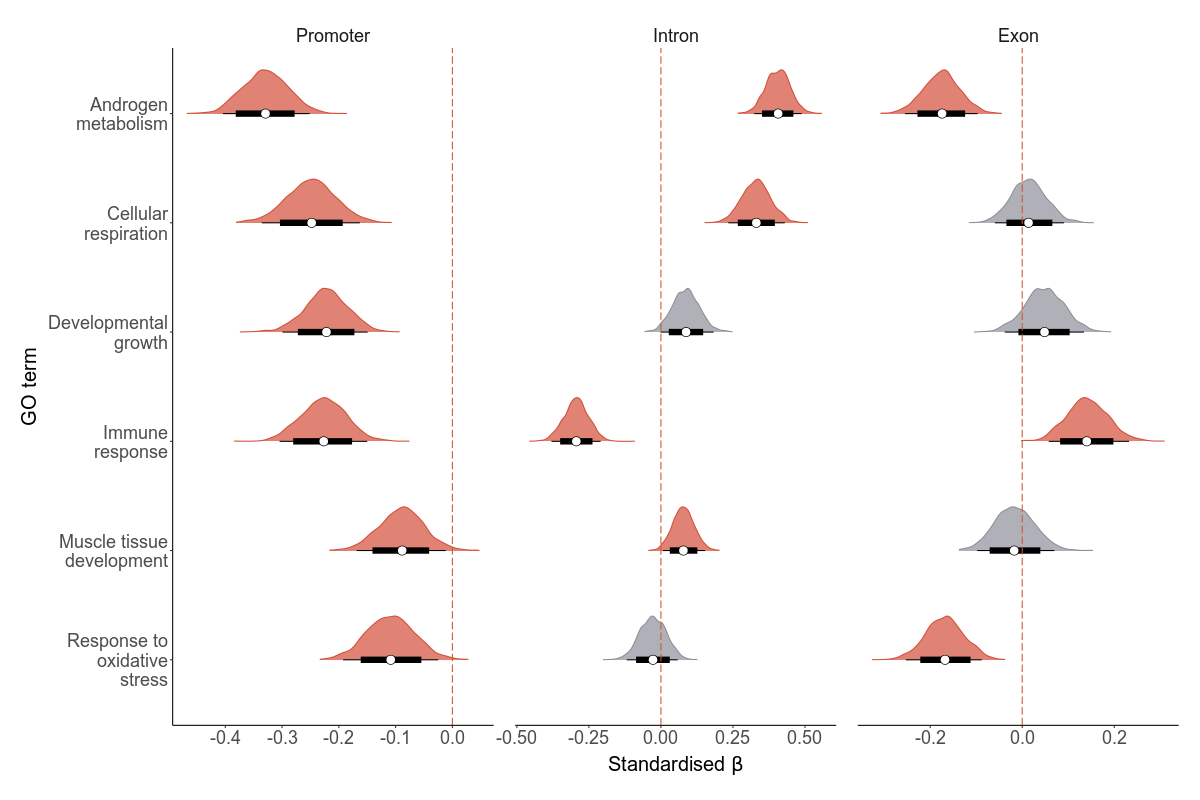
Deleterious mutations that disrupt certain biological processes might affect LMS more negatively than in others. To test if there are certain biological processes where deleterious mutations have negative fitness effects, we hypothesized six processes and used gene ontology annotations. We used Amigo to extract deleterious mutations associated with the GO terms: androgen metabolism, cellular respiration, developmental growth, immunity, muslce tissue development and response to oxidative stress. In the scripts below, you’ll see how we calculate total load based on these GO terms.
7.1.0.1 Subset mutations
First, we subset the mutations located in genes associated with each GO term, and calculate total load based on that subset. We also divide it per genomic region (promoter, intron, exon). We work with lists to iterate the process with ease by looping over the list items.
Code
#### load packages ####pacman::p_load(BiocManager, rtracklayer, GenomicFeatures, BiocGenerics, data.table, tidyverse, genomation, GenomicRanges, tibble)#### load the list of genes per GO term ####files <-list.files(path ="data/gene_lists_go", pattern ="*.txt", full.names = T)list <-list()for (i in1:length(files)){ data <-fread(files[i]) list[[i]] <- data}names(list) <-gsub("data/gene_lists_go/|.txt", "", files)#### extract only the unique gene names per GO term ####for (i in1:length(list)){ list[[i]] <- list[[i]] %>% dplyr::select(`V1`) %>%mutate(go_term =names(list[i])) %>% dplyr::rename(gene_id =`V1`) %>%unique() %>%mutate(gene_id =toupper(gene_id))}#### GERP ######## import gerp data ####load("output/load/gerp/gerp_over4.RData")gerp$chr <-gsub(";", "__", gerp$chr)gerp$chr <-gsub("=", "_", gerp$chr)gerp$chr_pos <-paste0(gerp$chr, "_", gerp$pos)# extract only the positions for annotationgerp_snps <- gerp %>% dplyr::select(chr, pos)gerp_snps$end <- gerp_snps$posgerp_snps$start <- gerp_snps$posgerp_gr <-as(gerp_snps, "GRanges")#### import gene regions ####### load annotation data ####annotation_dir <-"data/genomic/annotation"promoter=unique(gffToGRanges(paste0(annotation_dir, "/promoters.gff3")))exons_gene=unique(gffToGRanges(paste0(annotation_dir, "/exons_gene.gff3")))introns=unique(gffToGRanges(paste0(annotation_dir, "/introns_transcripts.gff3")))#### annotate gerp mutations ####gerp_promoter <-as.data.frame(mergeByOverlaps(gerp_gr, promoter)) %>%add_column("region_promoter"=1) %>%unique() %>% dplyr::select(c(`gerp_gr.seqnames`, pos, region_promoter,ID)) %>% dplyr::rename(chr = gerp_gr.seqnames)gerp_exons <-as.data.frame(mergeByOverlaps(gerp_gr, exons_gene))%>%add_column("region_exon"=1) %>%unique() %>% dplyr::select(c(gerp_gr.seqnames, pos, region_exon,ID)) %>% dplyr::rename(chr = gerp_gr.seqnames)gerp_intron <-as.data.frame(mergeByOverlaps(gerp_gr, introns))%>%add_column("region_intron"="1") %>%unique() %>% dplyr::select(c(gerp_gr.seqnames, pos, region_intron,ID)) %>% dplyr::rename(chr = gerp_gr.seqnames)gerp_list <-list(gerp_promoter, gerp_exons, gerp_intron)#### merge with 'similar to' column to get gene IDs ####lookup <-fread("../grouse-annotation/data/lookup_ANN_gene_id.txt")names(lookup) <-c("ann", "gene_id")for (i in1:length(gerp_list)){ gerp_list[[i]] <-left_join(gerp_list[[i]], lookup, by =c("ID"="ann"))names(gerp_list[[i]])[4] <-c("ann") gerp_list[[i]]$gene_id <-toupper(gerp_list[[i]]$gene_id)}#### extract snps per GO term ####go_snps_promo <-list()for (i in1:length(list)){ overlap <-subset(gerp_list[[1]], gene_id %in% list[[i]]$gene_id) go_snps_promo[[i]] <- overlap}go_snps_exon <-list()for (i in1:length(list)){ overlap <-subset(gerp_list[[2]], gene_id %in% list[[i]]$gene_id) go_snps_exon[[i]] <- overlap}go_snps_intron <-list()for (i in1:length(list)){ overlap <-subset(gerp_list[[3]], gene_id %in% list[[i]]$gene_id) go_snps_intron[[i]] <- overlap}# namenames(go_snps_promo) <-names(list)names(go_snps_exon) <-names(list)names(go_snps_intron) <-names(list)summary_snps_per_go <-data.frame()for (i in1:length(list)){ snps_go <-data.frame(go =names(list[i]),snps_promo =nrow(subset(go_snps_promo[[i]], region_promoter ==1)),snps_exon =nrow(subset(go_snps_exon[[i]], region_exon ==1)),snps_intron =nrow(subset(go_snps_intron[[i]], region_intron ==1)),og_genes_total =nrow(list[[i]])) summary_snps_per_go <-rbind(summary_snps_per_go, snps_go)}# how many genesgenes_n <-data.frame()for (i in1:length(list)){ promo <-subset(go_snps_promo[[i]], region_promoter ==1) exon <-subset(go_snps_exon[[i]], region_exon ==1) intron <-subset(go_snps_intron[[i]], region_intron ==1) genes <-unique(c(promo$gene_id, exon$gene_id, intron$gene_id)) genes_go <-data.frame(go =names(list[i]),n_genes =length(genes)) genes_n <-rbind(genes_n, genes_go)}write_tsv(genes_n, file ="output/biological_pathways/n_genes_gerp_per_go.tsv")#note: there are snps for every go term!#### extract genotypes per GO term #####promogenotypes_go_promo <-list()for (i in1:length(go_snps_promo)){ go_snps_promo[[i]]$chr_pos <-paste0(go_snps_promo[[i]]$chr, "_", go_snps_promo[[i]]$pos) geno <-subset(gerp, chr_pos %in% go_snps_promo[[i]]$chr_pos) geno$chr_pos <-NULL genotypes_go_promo[[i]] <- geno}names(genotypes_go_promo) <-names(list)#exongenotypes_go_exon <-list()for (i in1:length(go_snps_exon)){ go_snps_exon[[i]]$chr_pos <-paste0(go_snps_exon[[i]]$chr, "_", go_snps_exon[[i]]$pos) geno <-subset(gerp, chr_pos %in% go_snps_exon[[i]]$chr_pos) geno$chr_pos <-NULL genotypes_go_exon[[i]] <- geno}names(genotypes_go_exon) <-names(list)#introngenotypes_go_intron <-list()for (i in1:length(go_snps_intron)){ go_snps_intron[[i]]$chr_pos <-paste0(go_snps_intron[[i]]$chr, "_", go_snps_intron[[i]]$pos) geno <-subset(gerp, chr_pos %in% go_snps_intron[[i]]$chr_pos) geno$chr_pos <-NULL genotypes_go_intron[[i]] <- geno}names(genotypes_go_intron) <-names(list)#### SnpEff ######## extract only the unique gene names per GO term ######## import snpeff data ####load("output/load/snpeff/snpeff_high.RData")snpeff$CHROM <-gsub(";", "__", snpeff$CHROM)snpeff$CHROM <-gsub("=", "_", snpeff$CHROM)snpeff$chr_pos <-paste0(snpeff$CHROM, "_", snpeff$POS)# extract only the positions for annotationsnpeff_snps <- snpeff %>% dplyr::select(CHROM, POS)snpeff_snps$end <- snpeff_snps$POSsnpeff_snps$start <- snpeff_snps$POSsnpeff_gr <-as(snpeff_snps, "GRanges")#### import gene regions ######## annotate snpeff mutations ####snpeff_promoter <-mergeByOverlaps(snpeff_gr, promoter)snpeff_promoter <-as.data.frame(snpeff_promoter@listData)snpeff_promoter <- snpeff_promoter %>%add_column("region_promoter"=1) %>%unique() %>% dplyr::select(c(`snpeff_gr.seqnames`, POS, region_promoter,ID)) %>% dplyr::rename(chr = snpeff_gr.seqnames)snpeff_exons <-mergeByOverlaps(snpeff_gr, exons_gene)snpeff_exons <-as.data.frame(snpeff_exons@listData)snpeff_exons <- snpeff_exons%>%add_column("region_exon"=1) %>%unique() %>% dplyr::select(c(snpeff_gr.seqnames, POS, region_exon,ID)) %>% dplyr::rename(chr = snpeff_gr.seqnames)snpeff_introns <-mergeByOverlaps(snpeff_gr, introns)snpeff_introns <-as.data.frame(snpeff_introns@listData)snpeff_introns <- snpeff_introns%>%add_column("region_intron"=1) %>%unique() %>% dplyr::select(c(snpeff_gr.seqnames, POS, region_intron,ID)) %>% dplyr::rename(chr = snpeff_gr.seqnames)snpeff_list <-list(snpeff_promoter, snpeff_exons, snpeff_introns)#### merge with 'similar to' column to get gene IDs ####lookup <-fread("data/genomic/annotation/lookup_ANN_gene_id.txt")names(lookup) <-c("ann", "gene_id")for (i in1:length(snpeff_list)){ snpeff_list[[i]] <-left_join(snpeff_list[[i]], lookup, by =c("ID"="ann"))names(snpeff_list[[i]])[4] <-c("ann") snpeff_list[[i]]$gene_id <-toupper(snpeff_list[[i]]$gene_id)}#### extract snps per GO term ####go_snps_promo_snpeff <-list()for (i in1:length(list)){ overlap <-subset(snpeff_list[[1]], gene_id %in% list[[i]]$gene_id) go_snps_promo_snpeff[[i]] <- overlap}go_snps_exon_snpeff <-list()for (i in1:length(list)){ overlap <-subset(snpeff_list[[2]], gene_id %in% list[[i]]$gene_id) go_snps_exon_snpeff[[i]] <- overlap}go_snps_intron_snpeff <-list()for (i in1:length(list)){ overlap <-subset(snpeff_list[[3]], gene_id %in% list[[i]]$gene_id) go_snps_intron_snpeff[[i]] <- overlap}# namenames(go_snps_promo_snpeff) <-names(list)names(go_snps_exon_snpeff) <-names(list)names(go_snps_intron_snpeff) <-names(list)summary_snps_per_go <-data.frame()for (i in1:length(list)){ snps_go <-data.frame(go =names(list[i]),snps_promo =nrow(subset(go_snps_promo_snpeff[[i]], region_promoter ==1)),snps_exon =nrow(subset(go_snps_exon_snpeff[[i]], region_exon ==1)),snps_intron =nrow(subset(go_snps_intron_snpeff[[i]], region_intron ==1)),og_genes_total =nrow(list[[i]])) summary_snps_per_go <-rbind(summary_snps_per_go, snps_go)}genes_n_snpeff <-data.frame()for (i in1:length(list)){ promo <-subset(go_snps_promo_snpeff[[i]], region_promoter ==1) exon <-subset(go_snps_exon_snpeff[[i]], region_exon ==1) intron <-subset(go_snps_intron_snpeff[[i]], region_intron ==1) genes <-unique(c(promo$gene_id, exon$gene_id, intron$gene_id)) genes_go <-data.frame(go =names(list[i]),n_genes =length(genes)) genes_n_snpeff <-rbind(genes_n_snpeff, genes_go)}write_tsv(genes_n_snpeff, file ="output/biological_pathways/n_genes_snpeff_per_go.tsv")#note: there are snps for every go term!#### extract genotypes per GO term #####only select those with >10 snpsgo_snps_promo_snpeff <- go_snps_promo_snpeff[c(2,4:9)]go_snps_exon_snpeff <- go_snps_exon_snpeff[c(2,4:9)]go_snps_intron_snpeff <- go_snps_intron_snpeff[c(2,4:9)]#promogenotypes_go_promo_snpeff <-list()for (i in1:length(go_snps_promo_snpeff)){ go_snps_promo_snpeff[[i]]$chr_pos <-paste0(go_snps_promo_snpeff[[i]]$chr, "_", go_snps_promo_snpeff[[i]]$POS) geno <-subset(snpeff, chr_pos %in% go_snps_promo_snpeff[[i]]$chr_pos) geno$chr_pos <-NULL genotypes_go_promo_snpeff[[i]] <- geno}names(genotypes_go_promo_snpeff) <-names(go_snps_promo_snpeff)#exongenotypes_go_exon_snpeff <-list()for (i in1:length(go_snps_exon_snpeff)){ go_snps_exon_snpeff[[i]]$chr_pos <-paste0(go_snps_exon_snpeff[[i]]$chr, "_", go_snps_exon_snpeff[[i]]$POS) geno <-subset(snpeff, chr_pos %in% go_snps_exon_snpeff[[i]]$chr_pos) geno$chr_pos <-NULL genotypes_go_exon_snpeff[[i]] <- geno}names(genotypes_go_exon_snpeff) <-names(go_snps_exon_snpeff)#introngenotypes_go_intron_snpeff <-list()for (i in1:length(go_snps_intron_snpeff)){ go_snps_intron_snpeff[[i]]$chr_pos <-paste0(go_snps_intron_snpeff[[i]]$chr, "_", go_snps_intron_snpeff[[i]]$POS) geno <-subset(snpeff, chr_pos %in% go_snps_intron_snpeff[[i]]$chr_pos) geno$chr_pos <-NULL genotypes_go_intron_snpeff[[i]] <- geno}names(genotypes_go_intron_snpeff) <-names(go_snps_intron_snpeff)
7.1.0.2 Calculate mutation load
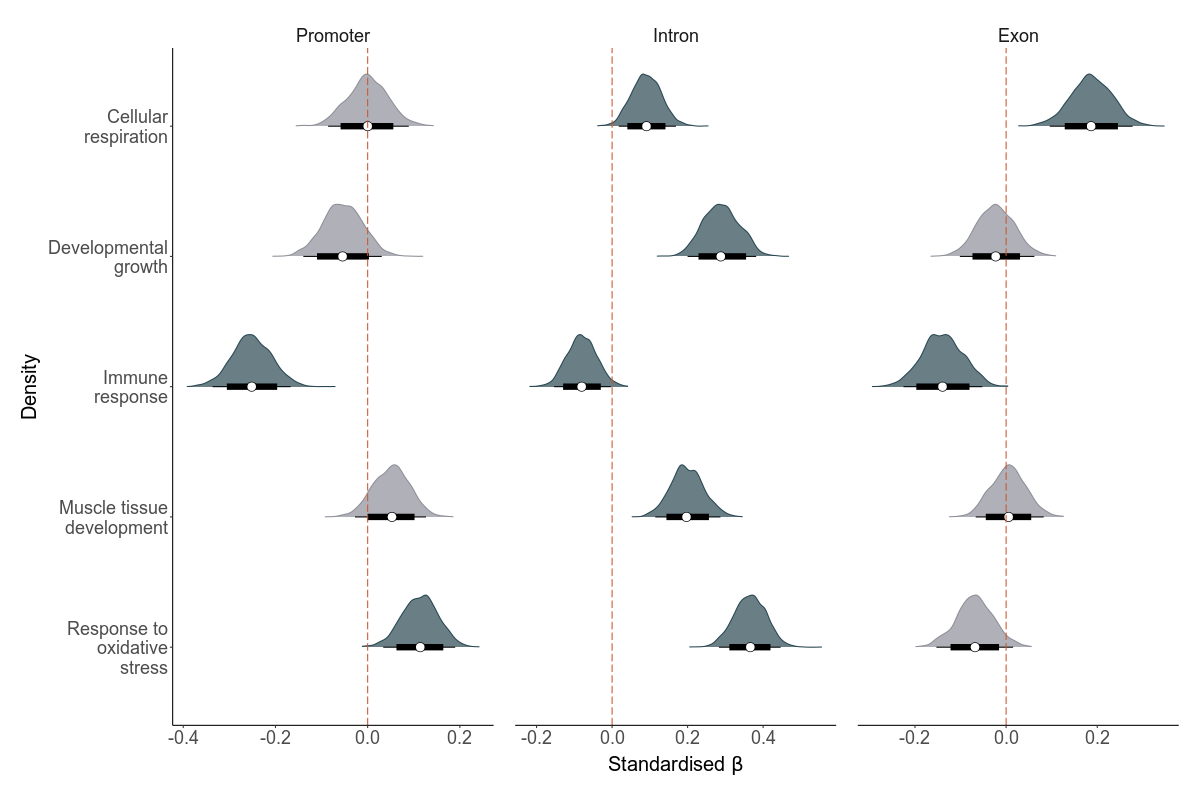
Then, we calculate the total load based on these subsets, again for GERP and SnpEff separately.
We then computed the exact same models as the total load models presented before with the following model structure:
LMS ~ scale(total_load) + core + (1|site)
Where total load is not a measure taken from a subset of deleterious mutations located within a specific genomic region and associated with a certain subset of genes.
high <-fread("../output/biological_pathways/intervals_high.tsv")high %>%kbl()
parameter
region
go
median
ci_95
ci_80
b_scaletotal_load
Exon
Cellular respiration
0.19
0.1, 0.28
0.13, 0.25
b_scaletotal_load
Exon
Developmental growth
-0.02
-0.1, 0.06
-0.07, 0.03
b_scaletotal_load
Exon
Immune response
-0.14
-0.23, -0.05
-0.2, -0.08
b_scaletotal_load
Exon
Muscle tissue development
0.01
-0.07, 0.08
-0.04, 0.06
b_scaletotal_load
Exon
Response to oxidative stress
-0.07
-0.15, 0.02
-0.12, -0.02
b_scaletotal_load
Intron
Cellular respiration
0.09
0.02, 0.17
0.04, 0.14
b_scaletotal_load
Intron
Developmental growth
0.29
0.2, 0.38
0.23, 0.35
b_scaletotal_load
Intron
Immune response
-0.08
-0.15, 0
-0.13, -0.03
b_scaletotal_load
Intron
Muscle tissue development
0.20
0.11, 0.29
0.14, 0.26
b_scaletotal_load
Intron
Response to oxidative stress
0.37
0.28, 0.45
0.31, 0.42
b_scaletotal_load
Promoter
Cellular respiration
0.00
-0.09, 0.09
-0.06, 0.06
b_scaletotal_load
Promoter
Developmental growth
-0.05
-0.14, 0.03
-0.11, 0
b_scaletotal_load
Promoter
Immune response
-0.25
-0.34, -0.17
-0.31, -0.2
b_scaletotal_load
Promoter
Muscle tissue development
0.05
-0.03, 0.13
0, 0.1
b_scaletotal_load
Promoter
Response to oxidative stress
0.11
0.03, 0.19
0.06, 0.16
These results indicate the results really depend on the GO term and region in question. But three patterns are clear: - GERP mutations in promoters of many GO terms are deleterious - GERP mutations in two or more genomic regions of the GO terms: androgen metabolism, immune response and response to oxidative stress are deleterious - High impact SnpEff mutations in all genomic regions of immune response are negative