8  Random subsampling

8.1 Introduction

Variation in the effects of mutation load among the various models presented could be attributed to variation in the effect sizes of the individual mutations, or alternatively due to the differences in the number of mutations that contribute to the mutation load estimate. Assuming that all mutations that are identified have negative fitness consequences to some extent, we can expect that a larger number of mutations explain more fitness variation. We tested for the effect of total load on LMS between GERP and SnpEff mutations and the four genomic regions by controlling for the number of mutations.

8.2 Methods

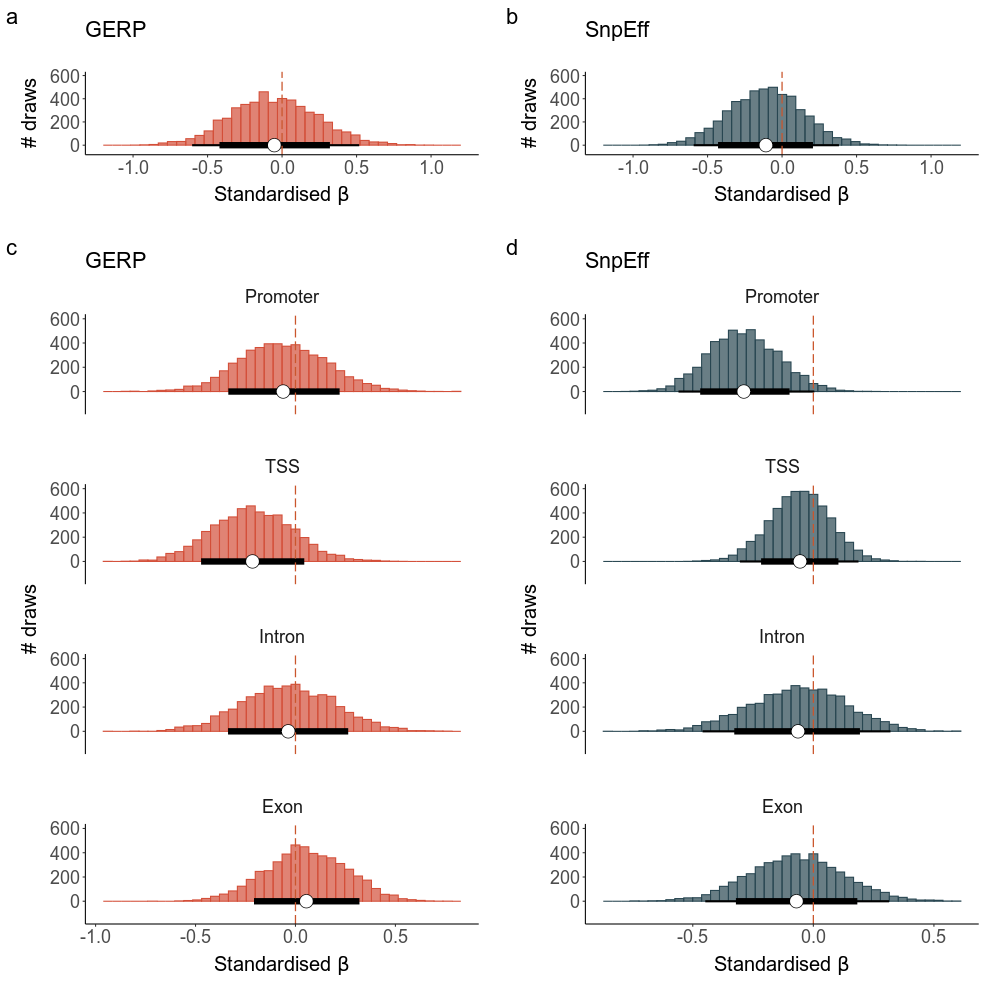
We randomly subset over all deleterioius GERP and SnpEff mutations (separately), and per genomic region for the two approaches.

First, we load in our data and make different subsets of the data: all GERP mutations, GERP mutations per region (4 dataframes) and the same for SnpEff mutations

Code
### load packages
pacman::p_load(tidyverse, data.table)

#load data mutations
load(file = "output/load/snpeff/snpeff_high.RData")
load(file = "output/load/gerp/gerp_over4.RData")

# load annotation data
load(file = "output/load/snpeff/snpeff_high_annotated_region.RData")
snpef_all$CHROM <- gsub("__", ";", snpef_all$CHROM)
snpef_all$CHROM <- gsub("HRSCAF_", "HRSCAF=", snpef_all$CHROM)
snpef_all$chr_pos <- paste0(snpef_all$CHROM, "_", snpef_all$POS)

load(file = "output/load/gerp/gerp_annotated_region.RData")
gerp_all$chr <- gsub("__", ";", gerp_all$chr)
gerp_all$chr <- gsub("HRSCAF_", "HRSCAF=", gerp_all$chr)
gerp_all$chr_pos <- paste0(gerp_all$chr, "_", gerp_all$pos)

### make subsets of mutations based on region
# subset snpef based on annotation
snpeff_exons <- subset(snpef_all, region_exon == 1)
snpeff_tss <- subset(snpef_all, region_tss == 1)
snpeff_introns <- subset(snpef_all, region_intron == 1)
snpeff_promoter <- subset(snpef_all, region_promoter == 1 & is.na(region_tss))

snpeff$chr_pos <- paste0(snpeff$CHROM, "_", snpeff$POS)

snpeff_exons_gt <- subset(snpeff, chr_pos %in% snpeff_exons$chr_pos)
snpeff_tss_gt <- subset(snpeff, chr_pos %in% snpeff_tss$chr_pos)
snpeff_introns_gt <- subset(snpeff, chr_pos %in% snpeff_introns$chr_pos)
snpeff_promoter_gt <- subset(snpeff, chr_pos %in% snpeff_promoter$chr_pos)

# subset gerp based on annotation
gerp_exons <- subset(gerp_all, region_exon == 1)
gerp_tss <- subset(gerp_all, region_tss == 1)
gerp_introns <- subset(gerp_all, region_intron == 1)
gerp_promoter <- subset(gerp_all, region_promoter == 1 & is.na(region_tss))

gerp$chr_pos <- paste0(gerp$chr, "_", gerp$pos)

gerp_exons_gt <- subset(gerp, chr_pos %in% gerp_exons$chr_pos)
gerp_tss_gt <- subset(gerp, chr_pos %in% gerp_tss$chr_pos)
gerp_introns_gt <- subset(gerp, chr_pos %in% gerp_introns$chr_pos)
gerp_promoter_gt <- subset(gerp, chr_pos %in% gerp_promoter$chr_pos)

We then create a function to execute the subsetting:

Code
## create function to subset X number of SnpEffs and model its effect on fitness

random_draws <- function(geno, n_draws, n_mutations, file, method, emperical_beta){
  source("scripts/theme_ggplot.R")
  all_draws <- data.frame()
  
  if(method == "GERP"){
    for (i in 1:n_draws){
      draw <- geno[sample(nrow(geno), n_mutations),] #randomly draw snps
      ## load functions
      source("scripts/7_calculate_load/function_calculate_load.R")
      load <- calculate_load_gerp(draw, output_vcf = F, loadtype = "random_draw") #calculate load
      model_out <- model_load(load, i)
      model_out$method <- method
      
      all_draws <- rbind(all_draws, model_out)
    }}
  
  if(method == "High impact"){
    for (i in 1:n_draws){
      draw <- geno[sample(nrow(geno), n_mutations),] #randomly draw snps
      ## load functions
      source("scripts/7_calculate_load/function_calculate_load.R")
      load <- calculate_load_snpeff(draw, output_vcf = F, loadtype = "random_draw") #calculate load
      model_out <- model_load(load, i)
      model_out$method <- method
      
      all_draws <- rbind(all_draws, model_out)
    }}
  
  ### conclusion
  all_draws <- all_draws %>% mutate(conclusion = as.factor(case_when(
    beta < 0 & pval < 0.05 ~ "Significantly negative",
    beta > 0 & pval < 0.05 ~ "Significantly positive",
    TRUE ~ "Insignificant"
  )))
  
  return(all_draws)
  save(all_draws, file = file)
}

### the model_load function looks like follows:


model_load <- function(load, ndraw){
  #join with phenotypes
  load("data/phenotypes/phenotypes_lifetime.RData") #LMS
  pheno <- pheno_wide %>% mutate(core = as.factor(case_when(is.na(LMS) ~ "no core", !is.na(LMS) ~ "core")))
  
  data_pheno <- left_join(load, pheno[,c("id", "LMS", "LMS_min", "core", "site", "born")], by = "id")
  
  model <- glmmTMB::glmmTMB(LMS_min ~ scale(total_load) + core + (1|site), family = "poisson", ziformula = ~1, data = data_pheno)
  summary <- summary(model)
  
  beta <- summary$coefficients$cond["scale(total_load)","Estimate"]
  se <- summary$coefficients$cond["scale(total_load)","Std. Error"]
  zval <- summary$coefficients$cond["scale(total_load)","z value"]
  pval <- summary$coefficients$cond["scale(total_load)","Pr(>|z|)"]
  
  out <- data.frame(ndraw = ndraw, 
                    beta = beta,
                    se = se,
                    zval = zval,
                    pval = pval)
  
  return(out)
}

Then we run this function for the 10 subsets of mutations, with varying number of mutations that get sampled:

Code
# run functions

# all mutations
draws_gerp <- random_draws(geno = gerp, n_draws = 5000, n_mutations = 1000, file = "output/random_draws/all_gerp.RData", method="GERP", emperical_beta = -0.21)
save(draws_gerp, file = "output/random_draws/all_gerp.RData")

draws_high <- random_draws(geno = snpeff, n_draws = 5000, n_mutations = 1000, file = "output/random_draws/all_high.RData", method = "High impact", emperical_beta = -0.07)
save(draws_high, file = "output/random_draws/all_high.RData")

# per region
# high
draws_high_promoter <- random_draws(geno = snpeff_promoter_gt, n_draws = 5000, n_mutations = 500, file = "results/random_draws/promoter_high.RData", method = "High impact", emperical_beta = 0)
save(draws_high_promoter, file = "output/random_draws/promoter_high.RData")

draws_high_tss <- random_draws(geno = snpeff_tss_gt, n_draws = 5000, n_mutations = 500, file = "results/random_draws/tss_high.RData", method = "High impact", emperical_beta = 0)
save(draws_high_tss, file = "output/random_draws/tss_high.RData")

draws_high_intron <- random_draws(geno = snpeff_introns_gt, n_draws = 5000, n_mutations = 500, file = "results/random_draws/intron_high.RData", method = "High impact", emperical_beta = 0)
save(draws_high_intron, file = "output/random_draws/intron_high.RData")

draws_high_exon <- random_draws(geno = snpeff_exons_gt, n_draws = 5000, n_mutations = 500, file = "results/random_draws/exon_high.RData", method = "High impact", emperical_beta = 0)
save(draws_high_exon, file = "output/random_draws/exon_high.RData")

# gerp
draws_gerp_promoter <- random_draws(geno = gerp_promoter_gt, n_draws = 5000, n_mutations = 500, file = "results/random_draws/promoter_gerp.RData", method = "GERP", emperical_beta = 0)
save(draws_gerp_promoter, file = "output/random_draws/promoter_gerp.RData")

draws_gerp_tss <- random_draws(geno = gerp_tss_gt, n_draws = 5000, n_mutations = 500, file = "results/random_draws/tss_gerp.RData", method = "GERP", emperical_beta = 0)
save(draws_gerp_tss, file = "output/random_draws/tss_gerp.RData")

draws_gerp_intron <- random_draws(geno = gerp_introns_gt, n_draws = 5000, n_mutations = 500, file = "results/random_draws/intron_gerp.RData", method = "GERP", emperical_beta = 0)
save(draws_gerp_intron, file = "output/random_draws/intron_gerp.RData")

draws_gerp_exon <- random_draws(geno = gerp_exons_gt, n_draws = 5000, n_mutations = 500, file = "results/random_draws/exon_gerp.RData", method = "GERP", emperical_beta = 0)
save(draws_gerp_exon, file = "output/random_draws/exon_gerp.RData")

8.3 Results

We can then plot the results as histograms:

Code
### load packages ####
pacman::p_load(tidyverse, ggpubr, extrafont, cowplot, data.table)

source("scripts/theme_ggplot.R")

#### total GERP #####
load(file="output/random_draws/all_gerp.RData")
load(file="output/random_draws/all_high.RData")

sum_gerp <- draws_gerp %>%
  summarize(lower_95 = quantile(beta, probs=c(0.025)),
            upper_95 = quantile(beta, probs=c(0.975)),
            lower_80 = quantile(beta, probs=c(0.1)),
            upper_80 = quantile(beta, probs=c(0.9)),
            mean = mean(beta))

ggplot(draws_gerp, aes(x = beta)) + 
  xlim(-1.2,1.2)+
  ylim(-50, 600)+
  geom_histogram(aes(fill = beta < 0, col = beta < 0), linewidth=0.5, bins=40)+
  scale_fill_manual(values =alpha(c("grey60", clr_gerp), 0.7)) + #
  scale_color_manual(values =c("grey60", clr_gerp)) +
  geom_segment(data=sum_gerp, aes(x = lower_95, 
                             xend = upper_95, 
                             y = 0), col = "black", linewidth=1)+
  geom_segment(data=sum_gerp, aes(x = lower_80, 
                             xend = upper_80, 
                             y = 0), col = "black", linewidth=3)+
  geom_point(data=sum_gerp,aes(x = mean, y = 0), fill="white",  col = "black", shape=21, size = 6)+
  geom_vline(xintercept = 0, col = "#ca562c", linetype="longdash", linewidth=0.6)+
  theme(plot.title = element_text(margin=margin(0,0,30,0)),
        panel.border = element_blank(),
        panel.grid = element_blank(),
        panel.spacing = unit(3,"lines"),
        strip.background = element_blank(),
        legend.position="none")+
  labs(x = expression("Standardised"~beta), y = "# draws", title = "GERP") -> total_gerp

We can then repeat this for the other subsets, leading to the following plots:

Random subsets